Alternative investments
February 15, 2023

Hedge Funds: Potential opportunities in a “bond picker’s market”

February 15, 2023
Global Head of Hedge Fund Research and Management
Michael Yannell
Head of Hedge Fund Research
SUMMARY

We believe that we are in, and will continue to see, a “bond picker’s market,” and that various hedge fund strategies may be key to finding potential opportunities therein.


Opportunities for various hedge fund strategies in the fixed income arena

Proponents of active management have frequently touted the idea of a “stock picker’s market” – that over the long term, fundamentals will dictate performance of individual equities, and that after periods of high correlation, managers with expertise in security selection will take advantage of differentiation between winners and losers – but we rarely hear the same in fixed income.

But why? Should it be the case that stocks present better opportunities for active management versus bonds?

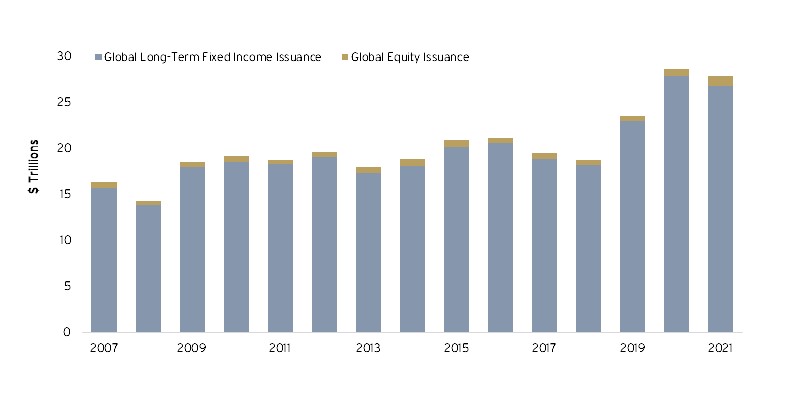
One might assume that this is because the stock market is larger and more active than the fixed income markets that they simply afford more opportunity. This, however, is simply not the case – the global fixed income markets are nearly identical in size to the global equity markets with both over $100 trillion in size, but fixed income typically has annual issuance of 20x that of equity securities.1

 
Figure 1 | Global fixed income and equity issuance
 
Source: Securities Industry and Financial Markets Association (SIFMA), as of December 31, 2021 Global Long-Term Fixed Income Issuance includes securities with maturity >13 months; includes corporate, municipal and sovereign issuance, Global Equity Issuance includes rank eligible, non-convertible IPOs and follow-on equity deals; excludes preferred shares, rights issued, closed end funds, business development companies, and special purpose acquisition companies.
 
If not market size and issuance, perhaps it is volatility. Stocks have historically seen bigger swings, creating potentially attractive entry points for professional stock pickers. However, while stocks and bonds are both negative in the most recent 12-month period, fixed income volatility has seen a larger, and consistently higher, spike up. As shown in Figure 3, while equity performance has been negative, equity volatility (measured by the VIX index) has been more in-line with historical norms versus the outsized rise in volatility we’ve seen in fixed income (measured by the MOVE index).
 
Figure 2 | Total return (last 12 months)
 
Source: Bloomberg, as of December 31, 2022; Past performance is not indicative of future returns. For illustrative purposes only. Indices are unmanaged. An investor cannot invest directly in an index. They are shown for illustrative purposes only and do not represent the performance of any specific investment. Real results may vary.
 
 
Figure 3 | Equity and fixed income volatility (last 12 months)
 
Source: Bloomberg, as of December 31, 2022; Past performance is not indicative of future returns. For illustrative purposes only. Indices are unmanaged. An investor cannot invest directly in an index. They are shown for illustrative purposes only and do not represent the performance of any specific investment. Real results may vary.
 
These dynamics support why we believe that we are in, and will continue to see, a “bond picker’s market,” and that various hedge fund strategies may be key to finding potential opportunities therein. These include:
  • Fixed income relative value
    We believe strategies that specialize in analyzing potential opportunities in the liquid fixed income markets such as sovereign debt and agency mortgage-backed securities should continue to see an attractive opportunity set. With the US Federal Reserve and other global central banks backing away from quantitative easing and bond buying programs, price discovery will be important and volatility, which had been more suppressed due consistent buying by central banks across sectors and maturities, may remain high.
  • Hedged macro
    Traditional global macro strategies can go through “boom and bust” cycles as they seek to identify and profit from a limited number of large trades on economic themes. Alternatively, hedge funds that seek hedged trading opportunities, informed by macroeconomic analysis, have historically been able to generate consistent returns without large swings in correlations to markets. We believe that such strategies are positioned to take advantage of trading within fixed income and currencies given the current market backdrop, especially with the challenges faced by central banks in balancing inflation and growth concerns.
  • Stressed and distressed debt
    Global bond yields rose sharply in 2022, amidst rate hikes from central banks and credit spread widening, driven by investor speculation regarding the potential for recession in 2023. These dynamics have led to a significant increase in the universe of below investment grade debt trading at stressed prices. These credits seek higher total return potential, including fallen angels and BB/B-rated debt. High yield bond and loan issuance for 2022 was down -78% and -65% compared to 2021, respectively.2 The slowdown in capital markets activity is providing opportunity for managers to step in and work with companies on strategies such as anchoring financings and initiating exchanges to address either capital needs or debt maturities. Further, while corporate default rates have remained below historical averages given the low interest rate environment and positive economic backdrop, we believe it is likely that defaults increase as capital is more expensive and harder to access. As such, we believe there will be potential for increased opportunities for managers with distressed experience in 2023, though restructuring expertise will likely be critical as managers who can influence the process can avoid the risk of low recoveries on defaulted debt.
 
Figure 4 | Historical high yield and loan default rates
 
Source: Citi Research, Moody, as of December 31, 2022; All forecasts are expressions of opinion and are subject to change without notice and are not intended to be a guarantee of future events.
 
 
Figure 5 | High yield distress is accelerating
 
Source: Citi Research, Citi Leveraged Loan Tracker, FTSE Indices, as of December 31, 2022
 
  • Multi-sector credit
    Even during less volatile market periods, there has been significant dispersion between various fixed income and credit sectors. Increased yields across fixed income and credit sectors may present an attractive entry point across various sub-sectors, but managers with tactical expertise, who are able to actively rotate their allocations, may benefit from an evolving opportunity set impacted by both macroeconomic policies and sector-specific fundamentals.
 
Figure 6 | Fixed income sub-sector returns, 2012-2022 (December 31, 2022)

Table showing fixed income sub-sector returns, sorted by return.
2012 2013 2014 2015 2016 2017 2018 2019 2020 2021 2022

CLO Debt
29.7%

CLO Debt
10.8%

Non-Agency RMBS
6.7%

Non-Agency RMBS
3.3%

High Yield
17.1%

Non-Agency RMBS
9.6%

US CMBS
4.6%

High Yield
14.3%

High Yield
7.1%

US CMBS
6.5%

Bank Loans
-0.6%

Non-Agency RMBS
25.9%

Non-Agency RMBS
8.9%

US CMBS
6.3%

EM Debt
1.3%

CLO Debt
11.2%

CLO Debt
8.8%

Non-Agency RMBS
3.0%

EM Debt
13.1%

EM Debt
6.5%

Non-Agency RMBS
5.9%

CLO Debt
-2.8%

US CMBS
24.8%

High Yield
7.4%

EM Debt
4.8%

US CMBS
0.7%

Bank Loans
10.2%

EM Debt
8.2%

Bank Loans
0.4%

US CMBS
11.3%

CLO Debt
5.5%

High Yield
5.3%

Non-Agency RMBS
-4.8%

EM Debt
17.9%

Bank Loans
5.3%

CLO Debt
3.4%

CLO Debt
0.0%

EM Debt
9.9%

US CMBS
7.9%

CLO Debt
-0.7%

CLO Debt
8.9%

Non-Agency RMBS
3.3%

Bank Loans
5.2%

High Yield
-11.2%

High Yield
15.8%

US CMBS
4.0%

High Yield
2.5%

Bank Loans
-0.7%

Non-Agency RMBS
5.4%

High Yield
7.5%

High Yield
-2.1%

Bank Loans
8.6%

Bank Loans
3.1%

CLO Debt
4.3%

US CMBS
-14.2%

Bank Loans
9.7%

EM Debt
-4.1%

Bank Loans
1.6%

High Yield
-4.5%

US CMBS
3.8%

Bank Loans
4.1%

EM Debt
-2.5%

Non-Agency RMBS
5.4%

US CMBS
-0.9%

EM Debt
-1.7%

EM Debt
-15.3%


Source: EM Debt represented by Bloomberg Emerging Markets Hard Currency Aggregate Index. US CMBS represented by ICE BofA BBB US Fixed Rate CMBS Index. High Yield represented by Bloomberg US Corporate High Yield Bond Index. Bank Loans represented by S&P/LSTA Leveraged Loan Total Return Index. Non-Agency RMBS represented by Citi RMBS Returns Doc - Overall Market - Nominal returns. CLO Debt represented by CLO BBB Unhedged (USD) DAILY TOTAL RETURN. Past performance is not indicative of future returns. For illustrative purposes only. Indices are unmanaged. An investor cannot invest directly in an index. They are shown for illustrative purposes only and do not represent the performance of any specific investment. Real results may vary. Please see glossary for a full description of indices shown.
 

Alternative investments

The Alternative Investments team combines global expertise and local insight to deliver compelling opportunities in private equity, real estate and hedge funds.

Find out more
Contact us

To help put you in touch with the right Private Bank team, please answer the following questions.

1 SIFMA, as of September 30, 2022

2 Source: Citi Research, S&P/LCD, as of December 31, 2022

Glossary

Diversifying and Directional are internal descriptors based on a fund’s strategy and objective that the Hedge Fund Research and Management team (“HFRM”) has developed and uses to categorize hedge funds. Such descriptors have not been approved by the portfolio managers noted above. The internal classification is subject to change without notice to investors. Many of the portfolio managers offer multiple products that could have different objectives or classifications from those shown above. Certain of the above referenced managers offer funds that are only available through a Citi advised feeder. Please review the fund’s particular confidential offering memorandum for more details.

These internal classifications are based on the analysis and subjective views of HFRM. The internal classification is subject to change without notice to investors and there is no guarantee that the funds will perform as described above. It is important to note that the market strategies described above may not completely eliminate market risk. There is no guarantee that hedge funds classified as “Diversifying” and “Directional” will perform as described above. Hedge funds should not be invested in based on their internal classification and other assets in a client’s overall portfolio should be taken into consideration before an investment is made.

Hedge funds can be highly illiquid and are not suitable for all investors. Investing in Alternative Investments is intended for experienced and sophisticated investors only who are willing to bear the high economic risks of the investment. Investors should carefully review and consider potential risks before investing. Additional information can be found in a fund’s confidential private placement memorandum. These risks may include:

  • loss of all or a substantial portion of the investment due to leveraging, short-selling, or other speculative practices;
  • lack of liquidity in that there may be no secondary market for the fund and none is expected to develop;
  • volatility of returns
  • restrictions on transferring interests in the fund;
  • potential lack of diversification and resulting higher risk due to concentration of trading authority when a single advisor is utilized;
  • absence of information regarding valuations and pricing;
  • complex tax structures and delays in tax reporting;
  • less regulation and higher fees than mutual funds; and
  • manager risk.

Individual funds will have specific risks related to their investment programs that will vary from fund to fund.